Cutting Off ISIS Funds?

Cutting off the financing for ISIS is critical.  Mark Gilbert writes: Dr. Christina Schori Liang, a senior fellow at the Geneva Centre for Security Policy, notes in a paper for the IEP that IS (also known as ISIL or ISIS) is “the richest terrorist organization in history, with an estimated wealth of $2 billion.” IS earns about $1.5 million a day from selling oil, producing as many as 40,000 barrels per day and selling for as little as $20 a barrel. The oil is smuggled through Iraq and Kurdistan, border guards are bribed, while donkeys and trucks traverse deserts and mountain passes to avoid detection. IS has its own underground pipelines and refineries; while coalition forces had destroyed 16 mobile refineries by the end of last year, they can be rebuilt for as little as $230,000.

Its income is boosted by trafficking people and auctioning slaves, kidnapping for ransom (raising $45 million last year), extortion, taxes on income, business revenues and consumer goods in the lands it controls, as well as looting and selling antiquities. The Financial Action Task Force reckons IS stole about $500 million late last year just by raiding state-owned banks in the territories it controls. As Liang argues, “the West has so far failed to impede ISIL’s financial gains which are marked by a fluidity and wealth never seen before.”

Strangling the flow of cash that allows IS to arm its jihadists and fund the local infrastructure in the regions it occupies could smother the organization in ways that may prove even more effective than bombing its bases. As the journal Studies in Conflict and Terrorism noted as long ago as 2004 in a report on al-Qaeda, though, terrorist groups typically rely on informal money transfer networks and under-regulated Islamic finance channels which are harder to close down.

Thomas Sanderson, co-director of the Transnational Threats Project at the Center for Strategic and International Studies, said:

Our options and appetite for more investment of blood and treasure in the fight against terrorism may be limited, but without addressing all dimensions of the financing threat, our progress over the years may be lost. If groups like ISIS can fill their coffers, run economies and consolidate their hold on power, we may be facing a new, more dangerous brand of global terrorism that will threaten the United States and its allies for years to come.

Driving a wedge between IS and the dollars it needs demands greater cooperation between the various countries that profess to oppose the group, more punishing sanctions against any nation found to have turned a blind eye to stolen oil crossing its borders, a coordinated refusal to pay ransoms, and severe retributions against anyone found to participate in the trading of looted treasure. Waging financial war on IS to undermine its ability to operate as a nation state should clearly be more of a priority than it has been so far.

1220226400918821922oil drill.svg.hi (1)

Connection of Refugee Movement to Jihadists Complicates Welcome

Nationalism and unity plays out in the EU

Ka Leers writes: When voters in both the Netherlands and France rejected a new EU constitution by referendum in 2005, governments across Europe were aghast. How could these voters come out in such numbers against the European Union, the machine that had so obviously ensured peace and prosperity for more than 50 years?

“Voters operate on the premise that they are the boss, not politicians,” says Hans Anker, a successful Dutch pollster who used to work with the famous American voter researcher Stan Greenberg. Anker was asked by the Dutch government to find out what the heck had happened.Extensive research and focus groups involving great numbers of Dutch voters after the referendum showed why many voters simply took it as an opportunity to slap the sitting government on the wrist. They felt that EU expansion – at the time the Union was on its way to adding 10 new member states – was being carried out without their permission.

Most voters in the referendum didn’t vote against the EU constitution itself, Anker found. Rather, they voted as they did because they felt that the European Union’s ever-expanding power was a train that kept moving forward – a locomotive commandeered by an elite that never asked them whether they approved of its chosen direction. “Nobody ever asked me anything; now I’ll show them.” That was the gist.

It appears that the refugee crisis is now driving this sentiment back to the fore, perhaps more than any other topic ever did – including the EU’s shock expansion in 2005. Wherever government leaders go against the grain and welcome refugees, as Germany Chancellor Angela Merkel did, massive swings in the polls are seen. In countries such as Switzerland and Poland, political parties that take an explicit stance against refugees have scored landslide electoral wins. In Germany itself, the Alternative for Germany – until quite recently fading in the polls – is now back with a vengeance, picking up additional voters with each passing poll. This is scaring even Merkel into taking a step back. She now supports building refugee centers on Germany’s southern borders in an effort to stop the influx, a proposition she vehemently opposed just a couple weeks back.

The attack on Paris and its connection to refugee movement complicated the issue.

Are Whistleblowers Adequately Protected?

Are whistleblowers protected in the US?

U.S. Sen. Elizabeth Warren, D-Mass., and Republican Chuck Grassley, of Iowa, urged the Securities and Exchange Commission this week for an update on the performance of so-called “whistleblower” protections created under the Dodd-Frank Act.

Warren and Grassley, in a letter to SEC Chair Mary Jo White, requested information on the agency’s Office of the Whistleblower, as well as asked about implementation of 2013 SEC Office of Inspector General recommendations, among other things.

According to Warren’s office, a 2013 OIG report regarding the implementation of protections created under the law, recommended that the Office of the Whistleblower establish standardized performance criteria for whistleblower complaints.

“The whistleblower program is an important tool in the SEC’s efforts to combat securities fraud and almost three years have passed since the SEC OIG evaluation of this program,” the senators stated in their letter. “We are writing to seek an update on the program’s performance and on OWB’s progress in implementing the OIG recommendations.”

Warren and Grassley urged the SEC chair to provide answers to several questions by Nov. 26, including: a description of progress in implementing the 2013 recommendations; the number of whistleblower tips, complaints and referrals received from July 2013 to June 2015; and the average time it took the office to review them upon receipt.

The senators also requested information regarding the average amount of time between posting a Notice of Covered Action and contacting the relevant whistleblower and the percentage of tips, complaints and referrals under investigation, among other data.

Under Dodd-Frank Congress expanded protections afforded to whistleblowers and provided incentives for reporting potential SEC violations, Warren’s office said. Two key provisions included in the law to expand whistleblower participation provided the SEC the authority to award cash payments to those who provide actionable tips and instructed the agency to create a new division to oversee the whistleblower program.

Warren’s letter came a week after the Democratic senator called on the SEC and Commodity Futures Trading Commission to implement rules that protect taxpayers and the financial system following Dodd-Frank changes.

whistleblower hat

How Disturbing is a Rising Dollar?

Is the dollar going to rise?

Anatole Kaletsky writes: The US Federal Reserve is almost certain to start raising interest rates when the policy-setting Federal Open Markets Committee next meets, on December 16.

Janet Yellen, the Fed chair, has repeatedly said that the impending sequence of rate hikes will be much slower than previous monetary cycles, and predicts that it will end at a lower peak level.  There is good reason to believe that the Fed’s commitment to “lower for longer” interest rates is sincere.

The Fed’s overriding objective is to lift inflation and ensure that it remains above 2%. To do this, Yellen will have to keep interest rates very low, even after inflation starts rising.

In the 1980s, Volcker’s historic responsibility was to reduce inflation and prevent it from ever rising again to dangerously high levels. Today, Yellen’s historic responsibility is to increase inflation and prevent it from ever falling again to dangerously low levels.

Under these conditions, the direct economic effects of the Fed’s move should be minimal. It is hard to imagine many businesses, consumers, or homeowners changing their behavior because of a quarter-point change in short-term interest rates, especially if long-term rates hardly move.

Many Asian and Latin America countries, in particular, are considered vulnerable to a reversal of the capital inflows from which they benefited when US interest rates were at rock-bottom levels. But, as an empirical matter, these fears are hard to understand.

The imminent US rate hike is perhaps the most predictable, and predicted, event in economic history.

What about currencies? The dollar is almost universally expected to appreciate when US interest rates start rising, especially because the EU and Japan will continue easing monetary conditions for many months, even years. This fear of a stronger dollar is the real reason for concern, bordering on panic, in many emerging economies and at the IMF. Fortunately, the market consensus concerning the dollar’s inevitable rise as US interest rates increase is almost certainly wrong, for three reasons.

First, the divergence of monetary policies between the US and other major economies is already universally understood and expected. Thus, the interest-rate differential, like the US rate hike itself, should already be priced into currency values.

Moreover, monetary policy is not the only determinant of exchange rates. Trade deficits and surpluses also matter, as do stock-market and property valuations, the cyclical outlook for corporate profits, and positive or negative surprises for economic growth and inflation. On most of these grounds, the dollar has been the world’s most attractive currency since 2009; but as economic recovery spreads from the US to Japan and Europe, the tables are starting to turn.

Finally, the widely assumed correlation between monetary policy and currency values does not stand up to empirical examination. In some cases, currencies move in the same direction as monetary policy – for example, when the yen dropped in response to the Bank of Japan’s 2013 quantitative easing. But in other cases the opposite happens, for example when the euro and the pound both strengthened after their central banks began quantitative easing.

For the US, the evidence has been very mixed. Looking at the monetary tightening that began in February 1994 and June 2004, the dollar strengthened substantially in both cases before the first rate hike, but then weakened by around 8% (as gauged by the Fed’s dollar index) in the subsequent six months. Over the next 2-3 years, the dollar index remained consistently below its level on the day of the first rate hike. For currency traders, therefore, the last two cycles of Fed tightening turned out to be classic examples of “buy on the rumor; sell on the news.”

Of course, past performance is no guarantee of future results, and two cases do not constitute a statistically significant sample. Just because the dollar weakened twice during the last two periods of Fed tightening does not prove that the same thing will happen again.

Can Insiders Work Around Regulations?

The systemic financial risk-taking in the lead up to the financial crisis was a product of untouchable insiders taking risks that favored the connected few. And the many still suffer. Cameron K. Murray write: Not only are there insider groups bridging Wall Street and financial regulators, but Defense Departments are a hotbed of revolving personnel into, and out of, private weapons and hardware manufacturers. At local government levels this type of revolving door of well-connected insiders is even more insidious, with land rezoning and infrastructure spending a constant battle between in the interests of the insiders and the community at large. The revolving door culture is now so pervasive that Federal Reserve Chairman Ben Bernanke, arguably the most powerful financial regulator in recent history, waltzed through the door to consult for a multi-billion dollar hedge fund with almost no media criticism. Few issues are more important than being governed in the interest of the few at the expense of the many. The economic costs of this behaviour are likely to be in the hundreds of billions of dollars annually. Yet from a standard economic viewpoint, the mechanism by which such favouritism occurs remains a mystery. To shine some light on the mechanisms in coordinating back-scratching, its costs, and potential institutional changes to combat it, I took the problem to the lab under computerised experimental conditions. While the results confirm a lot of common sense intuition, they are a leap forward in terms of our economic understanding of the problem. Regulatory capture is the name economists give to the perverse effects of the revolving door, yet its effects on behavior are not the product of a coherent theoretical framework. For regulators to act in the interests of their former, or potentially future, employers requires a level of implicit collusion that shouldn’t exist in a world of purely self-interested agents who would defect from any attempt to form a group of allied insiders. Something else must be going on. Another view in standard economics is that political favors are imagined to be auctioned by way of a lottery, where bidders devote their resources to non-productive activities, such as attending political fundraisers, up to the amount of their expected payoff from the political favor subject to the participation of others in the lottery. This is called rent-seeking. The prize of a political favour is open to anyone, and we should expect, just like we see in real lotteries, no specific entrenchment of particular interest groups and a high degree of randomness in allocation of political favors.  Back-scratching, corruption and regulation

2d58b5672ba9de9

State Banks the Answer?


Banking in the Spotlight in New Mexico
There was a recent Symposium in Albuquerque, New Mexico on November 7, 2015 to Promote Public Banking.

First of all, what is a Public Bank? I am not sure there is a good definition but presumably it is not a private bank or even a non-profit bank but in some sense is associated with government and I think we are talking here about something other than the Central Bank of a nation. Thus perhaps the best way to look at a Public Bank is that it is a bank owned by a political jurisdiction and intended to advance the interests of the political jurisdiction which presumably means the residents of that political jurisdiction. But there may be differences of opinion as to the range of services that need to be provided in order for this entity to be considered a bank. It is important to understand that certain banking functions are performed by governmental entities which do not have a bank charter. This could be important.

Here are statements by a state legislator. First, after eleven years in the Legislature, I was astonished to see, in a “weekly report of activity” from the LFC. The LFC is the Legislative Finance Committee which employs fiscal analysts who examine budgets and review the management and operations of state agencies, higher education institutions and public schools and participate in the state’s revenue estimating process. Buried in a paragraph updating us on department activity, the sentence that “the Department of Transportation had awarded a $6 million loan for a wastewater system with Estancia. The funds will be processed through the State Infrastructure Bank.”

I was astonished for two reasons: first, what is the Transportation Department doing lending money for waste water infrastructure? Second, what in the world is the State Infrastructure Bank? I confess in my time as a legislator, this entity had never been mentioned to me…at least I couldn’t recollect ever hearing about it. So I did a bit of internet research, and while the NM State Infrastructure Bank eluded my search, the general concept of state infrastructure banks produced a wealth of information. I now realize that we are among the states which have for years been utilizing this simple method of financing some of our projects for highways and water. I couldn’t determine for sure, but it appears in NM we have housed the “bank” in the department of transportation (bridges and roads would be one of the uses, so this makes sense).

State Infrastructure banks are “a well-regulated method for financing projects selected by the state. A low-interest, below market rate, loan is issued to finance the project. Repayments, including interest, return to the bank and are then available for lending out for additional projects.” What struck me about the existence of this mechanism is that it is precisely the way a public bank would function. We, in effect, already have one–just haven’t named it as such and haven’t made full use of its simple, elegant mechanism…so why not?

The power of the banking lobby. Their program fits with their overall strategy of convincing Americans that banking is far too complex an issue to be attempted by anyone but members of the banking brotherhood. Leave your financial dealings to us…you’ll just screw them up. This ignores the reality that is described in numerous books I’ve been reading on the topic following last fall’s symposium on public banking in Santa Fe. Ellen Brown’s “Web of Debt” is the cornerstone for the discussion. Michael Lewis, among others, has explored just how it was possible for the banking industry to get things so terribly wrong during the housing bubble and the resulting crash of 2008 in “The Big Short” and “Boomerang”. What becomes clear from these works is that bankers are NOT the smartest guys in the room; that in fact the incredible profit they are able to produce out of public financial dealings is in no way a necessity. Instead, there is plenty of room for a state (like North Dakota) or a City (as Santa Fe is attempting) to omit the banking industry from many (if not all) of its finances.

Like you, I think it would make sense to move slowly and carefully in incremental steps, building on those activities in state government that are already very much like public banking, like my new discovery of the State Infrastructure Bank (SIB) or the State Investment Council (SIC). What I would see happening first would be to expand the SIB’s role, increasing the amount and number of self-financed projects, projects in which we pay ourselves a modest return rather than see public money go into bankers’ vaults for no good reason. In time this could include issuing our own bonds. It could involve an initial deposit from the state operating reserves of a percent or two (each percent represents $62 million and we are currently carrying over 10% reserves, far more than actuaries say is necessary). That deposit, used to finance state or municipal projects (a la the SIB) would earn a better return than we now get from the reserves, which are not invested but retained in a private bank “until we need to withdraw it”.

Governance of a public bank is the big concern. It needs to be as independent as possible from the executive and the legislature. Decisions about its operation should be divorced from political considerations. We can do it…if North Dakota can. In time it could develop into a full-blown State Bank, one that buys a piece of commercial loans entered into by community banks, reducing the overall interest rate and fostering economic growth for local business. Banking in the Spotlight in New Mexico

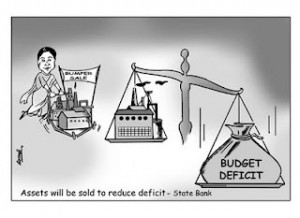
State Banks

Entrepreneur Alert: Doing Business in Mexico

The Mexican economy is growing, slowly but surely.

A Dallas Federal Reserve Reports indicates: Mexico’s economy continued growing in the third quarter. The government’s monthly gross domestic product (GDP) measure increased in July and August. In addition, recent data on exports, employment, retail sales and industrial production are all up. Inflation appears firmly under control despite the peso’s depreciation against the dollar. The consensus 2015 GDP growth forecast held steady in September at 2.3 percent.

Mexico’s Global Economic Activity Index, the monthly proxy for GDP, grew 0.4 percent in August after increasing 0.1 percent in July. The three-month moving average shows steady growth since the end of 2013 (Chart 1). Service-related activities (including trade and transportation) increased 0.5 percent in August, while goods-producing industries (including manufacturing, construction and utilities) grew 0.2 percent. Agricultural output expanded 6.6 percent. Official estimates of third-quarter GDP will be released Nov. 21. Mexico GDP grew 1.9 percent (annualized) in the first half of the year.

Exports grew 1 percent in September after dropping 6.4 percent in August. The three-month moving average of exports stabilized after declining for several months (Chart 2). Oil exports improved in late spring due to a slight recovery in oil prices; however, the trend was quickly reversed. Total exports were down 3 percent and oil exports were off 45 percent in the first nine months of 2015 compared with the same period a year ago. Manufacturing exports were up 2.3 percent year over year in September.

Mexico industrial production (IP) growth is recovering after pausing earlier in the year. Total IP – which includes manufacturing, construction, oil and gas extraction, and utilities – inched up 0.2 percent in August. Three-month moving averages show a turnaround in total IP (Chart 3). In addition, manufacturing IP continues on an upward trend. Meanwhile, U.S. IP fell 0.2 percent in September.

Retail sales rose 0.5 percent in July after growing 1.2 percent in June. The three-month moving average shows strong growth over the first seven months of the year (Chart 4). Year over year, retail sales are up 5 percent. However, consumer confidence worsened in August and September.

Formal-sector employment – jobs with government benefits and pensions – rose at an annualized rate of 3.7 percent in September (Chart 5). Year to date, employment is up an annualized 4.2 percent, which is about the same as the 2014 annual job growth rate.

The peso held steady against the dollar in October, when the exchange rate averaged 16.6 pesos per dollar versus 16.9 in September (Chart 6). The peso has lost 19 percent of its value against the dollar over the past 12 months. The Mexican currency has been unstable, in part due to the expectation of an increase in U.S. interest rates and the impact of falling oil prices on Mexico’s government finances. Oil revenues account for about a third of the federal government budget.

Inflation in September fell to 2.5 percent year over year (Chart 7), logging its fifth straight month at a rate below the central bank’s long-term inflation target of 3 percent. Consumer prices excluding food and energy rose 2.4 percent. Banco de México has kept the policy rate at 3 percent since June 2014 based on the belief that inflation expectations are well-anchored. However, policymakers have noted their intent to raise interest rates as soon as the Federal Reserve tightens U.S. monetary policy. Their objective is to prevent further deterioration of the peso, which could push up inflation.

Mexico Grows Slwly

Are Women Leaving the Workforce in the US?

Maria E. Canon, Helen Fessenden, and Marianna Kudlyak of the Richmond Federal Reserve write:  The female labor force participation (LFP) rate has dropped steadily since 2000, especially among single women. At the same time, the percentage of single women has grown as a share of the female population, a trend that has increased the impact of the single women’s LFP rate on the aggregate women’s LFP rate. An analysis of data from the Current Population Survey shows that a growing percentage of single women who are not in the labor force are going to school. Meanwhile, an increasing share of married women list retirement as the reason for no longer participating in the labor force.

A growing debate among economists concerns the causes and consequences of the drop in labor force participation (LFP) rate in the United States. In contrast to the unemployment rate, which shows the percentage of people in the labor force who are actively looking for work and cannot find it, the LFP rate measures what percentage of people age 16 and above do not participate in the labor force – for example, those who head into retirement or accept disability benefits, those who are too discouraged to search for work, or those who are not a part of the labor force for a variety of other reasons.

In October 2015, the unemployment rate was 5 percent – about where it was before the recession of 2007 – 09. But the LFP rate in the United States has continued to decline to around 62 percent, about 4 percentage points lower than it was before the recession. Citing this drop, some economists argue that there remains significant capacity for the labor market to tighten before wage growth picks up again. Other economists counter that much of the decline has to do with demographic forces and that many of these former workers are unlikely to return to the labor force. The rising number of retired workers in the Baby Boom generation, for example, is often cited as a driver for falling labor force participation.  Women Leaving the Workforce?

Costs of Higher Education in US

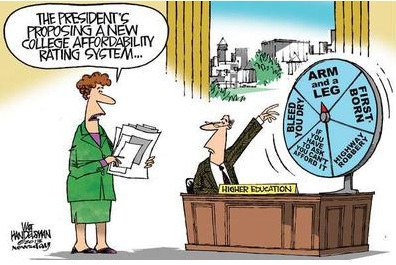
Evaluating higher education costs. which have become exorbitant in the US.

Elliott Morss writes:  Tuition and other costs have increased, but not primarily because of higher faculty salaries or more administrators. While these have gone up a small amount, fringe benefits, most notably health benefits, have increased more. And higher faculty costs have been offset by employing more part time faculty and increasing the use of teaching assistants. Student costs have increased substantially because of falling state and local government subsidies. In addition, higher education costs have risen significantly because of the hiring of a large number “non-teaching professionals.”

A major factor impacting school costs is the reduction in governments support and in particular, the reduction in state and local government assistance for public institutions. Table 1. – Costs of Attending Colleges/Universities (in 2011 $s)
educ1
Source: American Institutes for Research, Delta Cost Project, “Trends in College Spending: 2001–2011”

b. Growth in College/University Costs

Table 2 shows what happened to major school expenses per full-time equivalent (FTE) student in 2011 dollars. Several patterns are apparent. The fiscal squeeze resulting from the reduction in government support show up in the numbers for public and community colleges. And with the exception of these colleges, “student service” costs have increased dramatically.

Table 2. – Total Expenditures per FTE Student, 2001- 2011 (in 2011 $s)
educ2
Source: American Institutes for Research, Delta Cost Project, “Trends in College Spending: 2001–2011”

c. Staffing

Table 3 provides summary data on employees. The reduction in both Public University and Community College staffing is a manifestation of the reduction in government assistance. It is also notable how much higher the staffing levels of private institutions are than public.

Table 3. – FTE Employees per 1,000 FTE Students
educ3
Source: American Institutes for Research, Delta Cost Project, Donna Desrochers and Rita Kirshstein, “Issue Brief”, February 2014.

The large increase in “Other faculty” suggests a major substitution of full-time faculty by this group. It includes part-time as well as teaching assistants.

Table 4. – Growth in Staffing by Category, 1990 – 2012
educ4
Source: American Institutes for Research, Delta Cost Project, Donna Desrochers and Rita Kirshstein, op. cit.

d. Salaries

Table 5 provides data on what has happened to college/university wages and salaries. There have been substantial jumps in salaried research, but the funds for many of these payments come from funded research sources. The increase in payments for student services and maintenance are also notable.

Table 5. – Change in Wage/Salary Expenditures per Total FTE StaffFY 2002-FY 2010 (in 2011 $)
educ5

The evidence presented above indicate that for the 2001 – 2012 period, the costs of higher education grew, but not by much and not by the reasons usually cited – increased administrative staff and/or higher faculty salaries. The increases were felt because students are having to pay a significantly larger share of the tuition bill because government support has been declining. College/university costs are rising as the result of the hiring more non-faculty professionals. Faculty cost increases have been mitigated by hiring more part-time faculty and teaching assistants.

Higher Education Costs

Relationship Between Capital and Labor?

Since capital and labor tend to be complementary in the production of goods and services, the same factors that have slowed down capital accumulation since the early 2000s may have weakened businesses’ labor demand and may have decreased the labor share.

The Cleveland Federal Reserve reports:  The labor share of output – the ratio of labor compensation to output – has trended downward for decades, but it has declined at a faster rate since the early 2000s. The labor share in the nonfarm business sector hovered around 64 percent in the 1950s, declined to 61.4 percent in 2002, and dropped more rapidly thereafter. It is currently close to 57 percent.

Figure 1. Labor Share

A declining labor share means that wages grow less than productivity. Since the early 2000s, wages have risen much more slowly than productivity. Since 2002, real compensation per hour in the nonfarm business sector has grown at an average annualized rate of 0.74 percent, while productivity has grown at an average annualized rate of 1.79 percent.

Figure 2. Real Wage and Productivity

The causes of the long-term decline of the labor share are debated but likely include changes in the technology used to produce goods and services, increased globalization and trade openness, and developments in labor market institutions and policies.

According to Karabarbounis and Neiman (2013), the decrease in the relative price of investment goods, partly due to progress in information and communication technologies, has induced firms to replace labor with capital, thereby reducing the labor share. Elsby, Hobijn and Sahin (2013) find that part of the long-term decline in the labor share may be explained by the offshoring of labor-intensive production processes, which has led to a higher capital-labor ratio in U.S. production, and a lower labor share.

Lawrence (2015a and 2015b), however, points out that the labor share decline may be connected with a lower, rather than a higher, capital-labor ratio. Most estimates suggest that capital and labor tend to be complementary in the production of goods and services, which means that production requires the use of both capital and labor together, and it is difficult to substitute capital for labor or labor for capital. When capital and labor are complementary, a decrease in the capital-labor ratio is associated with a contraction in businesses’ demand for labor, which leads to a plunge in the wage rate and to a decline in the labor share. Lawrence then connects the labor share decline with a lower effective capital-labor ratio induced by labor-augmenting technological progress – a type of technological progress that raises the productivity of labor relative to capital and encourages businesses to substitute labor for capital.

Lawrence’s argument suggests that the steeper decline of the labor share since the early 2000s may be connected with the slowdown of capital growth in those years. Capital services, which grew at an average rate of 4.3 percent annually before 2002, have since grown only 2.2 percent annually on average. Capital services per hour, an indicator of the capital-labor ratio, grew at an average rate of 2.89 percent annually before 2002, but have since grown 2.05 percent annually on average.

Figure 3. Capital Services

Depending on the strength of the complementarity between capital and labor, a given decrease in the growth rate of the capital-labor ratio can be associated with a sizeable decline in the labor share. For instance, if we use an empirically plausible value for the strength of complementarity (an elasticity of substitution equal to 0.5), then a decrease in the capital-labor ratio of, say, 10 percent translates into a decrease in the labor share of approximately 2.5 percentage points, all else constant.

This suggests that the same factors that have slowed down capital accumulation since the early 2000s may have also weakened businesses’ labor demand, leading to a faster decline in the labor share and a wider gap between wage growth and productivity growth. One such factor could be the deceleration of multifactor productivity. Since 2005, multifactor productivity has grown 0.58 percent annually on average, more than a percentage point slower than in the previous 1996-2004 period, which was characterized by fast productivity growth.

Figure 4. Multifactor Productivity