China: Improving Communication on the Economic Message

Zhang Jun writes  At a forum in Canberra last year, Andrew Sheng quipped, “China is transparent, but only in the Chinese sense.” The statement provoked laughter among those who view China’s decision-making processes as opaque; but it was laughter born of the recognition that Sheng was right. In the run-up to a major policy decision in China, editorials by high-ranking authorities in major publications, as well as reports and communiqués from official forums and meetings, almost always provide clues about what will happen. You just have to know how to read them.

Many interpreted last August as a last ditch effort by the People’s Bank of China (PBOC) to stave off an economic crash.  But China is not really on the verge of a currency crisis at all. Given that all of this activity is taking place in the offshore renminbi market, which is small in scale and has only limited connections to mainland China’s financial system – the result of China’s hesitancy about financial-market liberalization and capital-account convertibility – the situation remains controllable. Add to that China’s other strengths – annual GDP of over $10 trillion, a growth rate at least four percentage points higher than the global average, $3 trillion in foreign-exchange reserves, a savings rate of 40% of GDP, and a massive trade surplus – and an exchange-rate crisis seems highly unlikely.

But that does not mean that there are no risks. On the contrary, China has a strong interest in curbing the volatility – and, given China’s centrality to the global economy, so does the rest of the world. The key will be to get markets and policymakers on the same page.

Chinese policymakers have shown a clear commitment to minimizing government intervention and promoting a market-oriented approach for setting interest and exchange rates. And the authorities have made significant progress toward this end.

In fact, the devaluation last August was accompanied by the announcement of a more market-oriented mechanism for setting the renminbi’s exchange rate in the interbank market, with the daily fixing rate based on the previous day’s closing price. That move, was a prerequisite for the addition of the renminbi to the basket of currencies that determine the value of the International Monetary Fund’s reserve asset, the Special Drawing Right.

But even when China attempted to create a more reliably market-based system, investors’ responses were skewed, with unfounded expectations of a substantial and consistent devaluation fueling speculation in international markets. The subsequent attempt by China’s State Administration of Foreign Exchange to stabilize expectations by declaring that the renminbi would be valued against an undisclosed basket of currencies, instead of just the US dollar, failed to convince them. Short trades continued to rage offshore, putting the renminbi under increasing pressure.

The PBOC has been working vigorously to prevent further misunderstandings by designing policies that will safeguard exchange-rate stability, while taking care not to transmit any signal that monetary easing is in the cards.

The PBOC clearly remains committed to stabilizing the exchange rate, while advancing its market-oriented goals.

China’s leaders have plenty of challenges ahead, and improved communication with markets could help to overcome them. Fortunately, it seems that China’s leaders recognize this imperative, and are working to meet it.

China's Economy

Federally-Owned Lands Improve Surrounding Economies

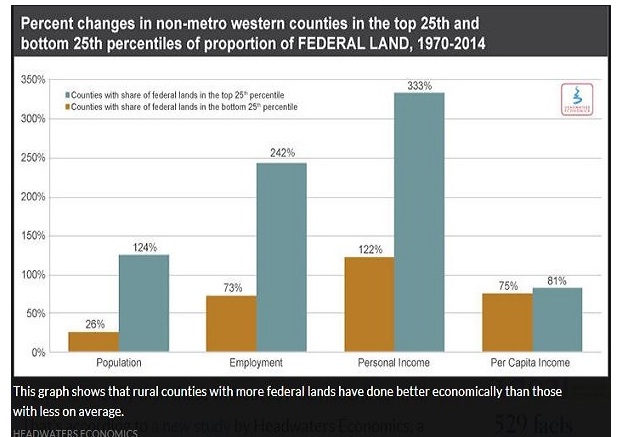
 Between 1970-2014, rural counties with a lot of federal lands did better financially than those without as much federal control. That’s according to a new study by Headwaters Economics, a non-partisan think tank based in Montana.  Economist Megan Lawson led the study which drew averages from around the West. She says federal lands aren’t necessarily the reason why those rural counties were better off, but that having federal land doesn’t automatically spell economic ruin. The graphic does not show median income comparisons which would reflect on whether high concentrations of federal lands correlate with less income inequality or not. 

US Federal Lands

M or F Not Important in Interpreting Brains

Gina Rippon writes:  The latest neuroscientific techniques employed to measure and map those brain structures and functions which might distinguish the two sexes are discussed in a recent special issue from the Royal Society. Daphna Joel had previously published a study of structures and connections in over 1,400 brains from men and women aged between 13 and 85, in which no evidence was found of two distinct groups of brains that could be described as either typically male or typically female. Brains were more typically unique “mosaics” of different features – something more correctly characterised as a single heterogeneous population.

Such a mosaic of features cannot be explained in purely biological terms; it is a measure of the effect of external factors. This is true even at the most fundamental level. For example, it can be shown that a “characteristically male” density of dendritic spines or branches of a nerve cell can be changed to the “female” form simply by the application of a mild external stress. Biological sex alone cannot explain brain differences; to do so requires an understanding of how, when and to what extent external events affect the structure of the brain.

The notion that our brains are plastic or malleable and, crucially, remain so throughout our lives is one of the key breakthroughs of the last 40 years in our understanding of the brain. Different short- and long-term experiences will change the brain’s structure. It has also been shown that social attitudes and expectations such as stereotypes can change how your brain processes information. Supposedly brain-based differences in behavioural characteristics and cognitive skills change across time, place and culture due to the different external factors experienced, such as access to education, financial independence, even diet.

The importance of this to the male/female brain debate is that, when comparing brains, it’s necessary to know more than just the sex of their owners.

Understanding how much the brains being examined are entangled with the worlds in which they exist must be part of any attempt to try and answer the question of what, if anything, separates male and female brains.

What is really meant by a “sex difference”? Taken straightforwardly, one would assume a “difference” implies the two groups measured are distinct. That the characteristics true of one are almost always not true of the other, that it’s possible to predict characteristics based on sex or vice versa, or that knowing to which group an individual belonged would allow you to reliably predict their performance, responses, abilities and potential. But we now know that this simply doesn’t reflect reality.

On a wide range of psychological measures, it’s clear that the two sexes are actually more similar than different.

The whole issue of male/female differences in the brain and the implications for male/female differences in any sphere – normal or abnormal behaviour, ability, aptitude or achievement – is really important to clarify. In the US, the National Institutes of Health recently mandated that, where appropriate, sex of the test subjects should be a variable in any research it funds.

The Brain

Greece is in Trouble Again?

It was just over a year ago that Greece elected Alexis Tsipras and Syriza amid a flurry of anti-austerity sentiment.

Things didn’t exactly go as planned.

The new PM and his “radical” finance minister Yanis Varoufakis thought they could shake things up in Brussels and wrench Greece from the clutches of Berlin-style fiscal rectitude. As it turns out, Wolfgang Schaeuble is not a man who is easily bested at the bargaining table and after more than six months of negotiations, the imposition of capital controls, a referendum on the euro that Tsipras promptly sold down the river, Greeks ended up facing an outright depression.

In the end, Varoufakis unceremoniously resigned and Tsipras agreed to a third bailout before calling for snap elections that would ultimately see the PM re-elected albeit at the helm of a party that was completely gutted by the arduous bailout talks.

As we and quite a few others warned, the new bailout and the attached terms would do exactly nothing to turn the Greek economy around. We’re all for being responsible with the budget but you can’t very well implement fiscal retrenchment during a depression unless you intend to remain in said depression in perpetuity, but alas, that’s exactly what Brussels forced Greece to do and the country has slipped back into recession.

With opposition mounting to the government’s pension reform plan, the European Union pressuring it to stem the tide of refugees entering the country and the global market rout hastening the sell-off in Greek assets, dark clouds are gathering again.  Ironically, capital controls appear to have helped the economy perform better than expected: “The economy fared less badly than those initial expectations in part due to a 90 percent annualized increase in cashless payments since the introduction of capital controls in June, shifting activity out of the shadow economy.” Another justification for banning cash we suppose.

Earlier this month we noted that Greek bank stocks were cut in half in just a matter of 72 hours while Greek equities as a whole had fallen to their lowest levels since 1989. Yields on the Greek 10Y had spiked back above 10%.

Greece, sources told MNI, “seems unable to deliver” on a number of measures Brussels says Athens needs to implement an effective fiscal consolidation plan. “We agreed to disagree,” one official said. “Judging from (last week’s) talks, the negotiations could drag for months. Anyway, I don’t see any real funding needs for Greece until June,” the official went on to note.

Greek riot police fired tear gas at farmers protesting against pension reform plans on Friday who hurled stones at the agriculture ministry in central Athens ahead of a major demonstration outside parliament scheduled for later in the day,

Greece is not “fixed.” And even as the farmers swear “they won’t make us bend,” something will have to give because Grexit fears to resurface once again [if all sides adopt] a plan built on over-optimistic assumptions.

Throw in a couple of hundred thousand refugees that are lliterally arriving in boats and you’ve got a particularly precarious situation that will likely devolve into the type of chaos shown above on an increasingly frequent basis.

Greece Saved?

World’s Oil Supplies and Suppliers

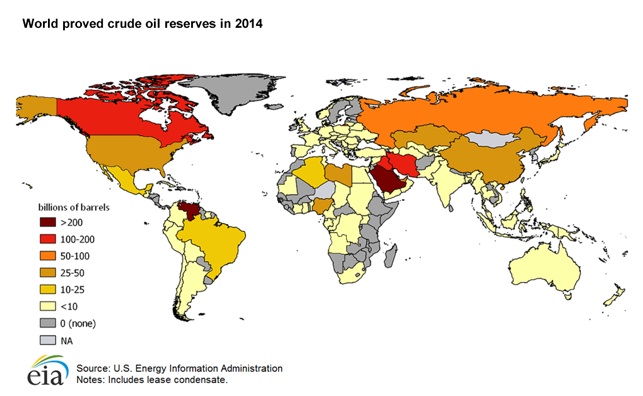
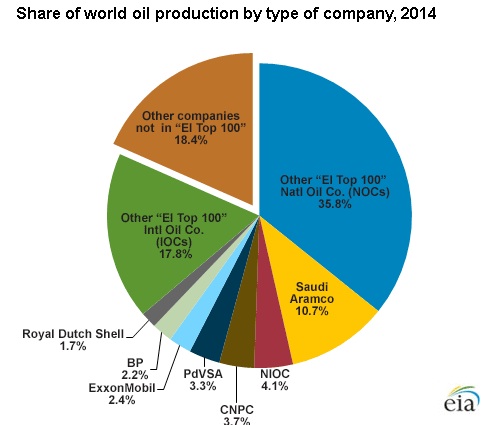
The world oil market is complex. Governments and private companies play various roles in moving oil from producers to consumers. Government-owned national oil companies (NOCs) control most of the world’s proved oil reserves (75% in 2014) and oil production (58% in 2014). International oil companies (IOCs), which are often stockholder-owned corporations, make up the balance of global oil reserves and production. Proved oil reserves consist of the amount of oil in a given area, known with reasonable certainty, that current technology can recover cost effectively. Worldwide proved oil reserves in 2014 were almost 1.7 trillion barrels, and global oil production averaged roughly 93.2 million barrels a day.

Oil Reserves

There are different types of oil companies

There are three types of companies that supply crude oil to the global market. Each type of company has different operational strategies and production-related goals:

  1. International oil companies (IOCs): These companies, which include ExxonMobil, BP, and Royal Dutch Shell, are entirely investor owned and primarily seek to increase their shareholder value. As a result, IOCs tend to make investment decisions based on economic factors. These companies typically move quickly to develop and produce the oil resources available to them and sell their output in the global market. Although these producers are affected by the laws of the countries in which they produce oil, all decisions are ultimately made in the interest of the company and its shareholders, not in the interest of a government.
  2. National oil companies (NOCs): These companies operate as an extension of a government or a government agency, and they include Saudi Aramco (Saudi Arabia), Pemex (Mexico), the China National Petroleum Corporation (CNPC), and Petróleos de Venezuela S.A. (PdVSA). These companies support government programs financially and sometimes strategically. These companies often provide fuels to domestic consumers at a lower price than the fuels they provide to the international market. These companies do not always have the incentive, means, or intention to develop their reserves at the same pace as investor owned international oil companies. Because of the diverse objectives of their supporting governments, these NOCs pursue goals that are not necessarily market oriented. The goals of these companies often include employing citizens, furthering a government’s domestic or foreign policies, generating long-term revenue to pay for government programs, and supplying inexpensive domestic energy. All NOCs belonging to members of the Organization of the Petroleum Exporting Countries (OPEC) fall into this category.
  3. NOCs with strategic and operational autonomy: The NOCs in this category function as corporate entities and do not operate as an extension of the government of their country. This category includes Petrobras (Brazil) and Statoil (Norway). These companies often balance profit-oriented concerns and the objectives of their country with the development of their corporate strategy. Although these companies are driven by commercial concerns, they may also take into account their nation’s goals when making investment or other strategic decisions.

In 2014, 100 companies produced 82% of the world’s oil. NOCs accounted for 58% of global oil production.

Companies Share of Oil Production

Why Don’t Bankers Go To Jail?

Philip Angelides, a former Treasurer of California, headed the commission which issued a report which was widely criticized, both by those who felt is didn’t go far enough (see references below) and by some commission members who felt it went too far and resulted in conflicting minority reports.  

“I ask a simple question: how could the banks have engaged in such massive misconduct and wrongdoing without a single individual being involved? In a sense, it’s the immaculate corruption. It defies common sense, and the people of America know this.”     Angelides Letter to Department of Justice

Jail Bankers?

Is it Easier to Obscure Economic Truths with Words or Equations?

Philip Pilkington writes: Does mathematics, due to its formal nature, provided economists with clarity? This was then typically followed up with appeals to how economics might become a science by increasingly mathematising.

A good example of mathematics providing clarity is the case of the Keynesian multiplier. Even without inputting any numbers into the equation we can immediately discern the factors that will generate equilibrium income. It will be a component of autonomous consumption, investment, I, government spending, and exports, minus autonomous imports. It will also be positively multiplied by the consumption multiplier, and negatively multiplied by the import multiplier.

We know this because the components of income are in the numerator of the equation, while the multipliers are in the denominator. The multipliers are also being subtracted from/added to 1. The larger the denominator, the smaller the numerator and vice versa. So, anything that “subtracts” from the denominator — e.g. the consumption multiplier — will increase the ratio (same directional effect as adding to the numerator), while anything that “adds” to the denominator — e.g. the import multiplier — will decrease the ratio (same directional effect as subtracting from the numerator.

Compare this presentation, however, with your typical econometric study. Such studies contain innumerable “black boxes” in that the reasoning behind the assumptions made is often entirely unclear.

One thus spends hours attempting to interpret and reconstruct such a study and, all too often, one comes away realising that the assumptions lead one inevitably to interpret the results as being almost entirely arbitrary.

One recognises the labour that goes into such studies but at the same time untangling it becomes “a nightmare to live with”. Why? Because such studies do not promote clarity at all. Instead they promote complete and total obscurantism.

This is not to say that econometrics is entirely useless. As Keynes says in the Tinbergen critique: This does not mean that economic material may not supply more elementary cases where the method will be fruitful. Take, for instance, Prof. Tinbergen’s third example-namely, the influence on net investment in railway rolling-stock of the rate of increase in traffic, the rate of profit earned by the railways, the price of pig iron and the rate of interest. Here there seems a reasonable prima facie case for expecting that some of the necessary conditions are satisfied.

Alas, however, these mathematical techniques have a tendency, not to clarity at all, but to obscurantism and the moment one gives people a ticket allowing them to engage in obscurantist practices one runs the risk of spiking the proverbial punch.

It is far, far more difficult to engage in obfuscation and magical nonsense when using plain English than it is when using mathematics; not to mention the fact that it is far easier to catch people out. And as a general rule-of-thumb it is probably not unfair to say that as the number of equations grows, the lack of clarity tends to increase and so too do the difficulties in sorting the wheat from the chaff. It is thus the multiplication and proliferation of equations that tends to give rise to nightmares.

Math and Economics

Negative Rate Creep?

The negative-rates club is growing. But there is a limit to how low rates can go, according to the economist.  But they do not define what that limit is.

The Economist suggests: Let’s take a different look at what negative interest rates mean from the point of view of supply and demand.  The -1% deposit rate for Switzerland indicates the expectation that the Swiss franc will buy about 10% more than it will today in 10 years.  (To be exact, the expectation is for 10.46% more value.)  Why will it buy more?  Well, for just the opposite reason that +1% interest rates indicate a 10% loss of value expectation over 10 years.  With the loss of value the effect is known as inflation which is generally considered due to too much money chasing too few goods.  The solution for inflation is to make money more expensive or less available.  The opposite applies for monetary deflation implied by negative interest rates:  There is not enough money available to buy the goods available.  In the current environment the shortage results from an excess of “debt goods” to be bought.  So the solution to deflation is either to make the goods more scarce (write off debt) or increase the amount of money available.  QE is a process attempting to make debt instruments more scarce in the economy, although the scarcity may be temporary if the central bank later sells debt securities, as opposed to debt write-off which is forever permanent.  (“Forever permanent ” is a deliberate redundancy, for emphasis.)  See the preceding article for a view that rising wages and incomes are going to supply the money that will reduce deflation (or increase inflation).

But we ask the following question:  Where will the money come from to pay the higher wages?  The choices we suggest are (the third is not done today with the existing monetary system):

  1. Fewer people employed.
  2. More debt to create additional money.
  3. Infusion of money without the creation of debt.

How Women in the Workforce Help the Norwegian Economy

Any country’s main asset is its workforce, and Norway, with its oil wealth, is no exception. Sustainable policies for low unemployment and high participation rates for women, men and young people are predominant and the burden sharing of the cost of the welfare state is carried on the back of the labour force.

In the last 50 years, there has been a tremendous change in women’s participation in paid work in most OECD countries. Labour market participation has been a key to economic independence for women. It has given women the possibility to develop and use their professional skills. Employment among women is also crucial for economic performance. This may prove especially important in the years to come, as an ageing population will place an increasingly severe burden on public finances. Old age pension expenditure will increase, as will government outlays for health care. Low birth rates will add to the problem, and a shrinking working-age population will have to provide for an increasing number of pensioners. To encourage women with children to go out to work, Norway and the other Nordic countries have implemented policies that make it easier to combine work and family life.

Now some 83% of mothers with small children are employed. Fertility rates have risen along with the rise in labour participation, from 1.75 children per woman at the end of the 1970s to 1.9 children per woman today–one of the highest fertility rates in Europe.

The increase in female employment in Norway took place at a time when there was a rise in demand for labour, and alongside a remarkable boost in educational attainment among women. Secondly, employment among women was stimulated by comprehensive parental provisions and subsidised day-care for children. In 1970 only 13,000 Norwegian children were enrolled in day-care centres. Today the number is about 280,000 with coverage of almost 90% of all 1-5 year olds. Parental leave for employed mothers and fathers is paid from public budgets and has been extended from 12 weeks 30 years ago to 47 weeks today. Other measures are a statutory right to paid leave to stay at home with sick children and a right to work part-time until the youngest child turns 12.

Choosing workers from a pool of male and female workers, as opposed to choosing from a pool where half of the potential talent is excluded, leads to productivity gains. Secondly, higher female labour participation has led to productivity gains through a higher degree of specialisation. And finally, female employment has added more workers to the work force at a time when average work hours per employed person have been declining. .

In fact, if the level of female participation in Norway were to be reduced to the OECD average, Norway’s net national wealth would, all other factors being equal, fall by a value equivalent to our total petroleum wealth, including the value of assets held in the Government Pension Fund-Global (GPG, formerly the petroleum fund).

The next step for Norway will be to find ways to encourage people to move from part-time work to full-time work. With family provisions and childcare already in place,  this is within reach.

Women in the Norwegian Workforce

More Women At the Top Increases Corporate Success

New research from The Peterson Institute for International Economics and Ernst and Young shows that having more female leaders in business can significantly increase profitability. The report, Is Gender Diversity Profitable? Evidence from a Global Study, reveals that an organization with 30 percent female leaders could add up to 6 percentage points to its net margin. This in-depth new study analyzes results from approximately 21,980 global publicly traded companies in 91 countries from a variety of industries and sectors.

“The impact of having more women in senior leadership on net margin, when a third of companies studied do not, begs the question of what would be the global economic impact if more women rose in the ranks?” said Stephen R. Howe, Jr., EY’s US Chairman and Americas Managing Partner. “The research demonstrates that while increasing the number of women directors and CEOs is important, growing the percentage of female leaders in the C-suite would likely benefit the bottom line even more.”

The research uncovered that nearly one-third of companies globally have no women in either board or C-suite positions, 60 percent have no female board members, 50 percent have no female top executives, and less than 5 percent have a female CEO. Yet, the positive correlation between women in C-level ranks and the bottom line is demonstrated repeatedly, and magnitude of the estimated effects is substantial.  Although the study found that there is no statistically observable impact of having a female CEO on organizational profitability, and the impact of women’s presence on the board is not statistically robust, the importance of having female management and presumably a pipeline of female future leaders is both robust and positive.

“As many companies and governments have rightly increased their focus on gender diversity in corporate leadership, The Peterson Institute and EY wanted to explore what key areas in business roles and in societal support for women in those roles, have the greatest return for revenue and economic growth,” said Adam Posen, President, The Peterson Institute for International Economics. “We have found that some policy initiatives are more promising than others to deliver benefits while promoting gender equality, and that the emphasis should be on increasing diversity in corporate management. At a minimum, the results from our unique global study strongly suggest the positive impact of gender diversity on firm performance and identify in which sectors and countries the most progress on diversity needs to be made.”

While no country has reached gender parity, there is substantial international variation in women’s representation. National averages for women’s participation on boards range from 4 percent in the case of Mexico to roughly 40 percent in Norway, with Latvia and Italy next in line at 25 and 24 percent, respectively. Similarly, fewer than 11 percent of Mexican executives are women, while women account for more than a third of Latvian and Bulgarian executives.

The research reveals differences across industry sectors, with the financial, healthcare, utility and telecommunications sectors exhibiting the highest rates of female executive and board representation, ranging from 16-18 percent for women executives, and 12-14 percent for women directors. Basic materials, technology, energy and industrials are the sectors exhibiting the lowest representation of women in top positions, ranging from 10-12 percent for women executives and 8-10 percent for women directors.

The research addresses other issues that impact women’s presence in corporate leadership, which is positively correlated with firm characteristics such as size, as well as national characteristics including policies for women’s education and family leave. The research’s statistical results suggest that at the firm level, the size of the company and the size of the board are robustly correlated with the presence of women on boards and in upper executive ranks (though not as CEOs).

This research sheds light on the importance of establishing modern workplace benefits, providing equitable sponsorship opportunities, and creating inclusive work environments.

The data points to other policy indicators positively correlated with gender diversity in management, and thus profitability, that  are often overlooked, including the importance of paternal (not just maternal) leave, and openness to foreign investment, which could be interpreted as a sign of broader tolerance for new ways of doing business. Paternity leave – resources that would allow, and even encourage, fathers to participate more equitably in taking care of children – is significantly greater in the economies with more gender-balanced corporations: the top 10 economies had 11 times more paternity leave days than did the bottom 10.