Why Don’t Bankers Go To Jail?

Philip Angelides, a former Treasurer of California, headed the commission which issued a report which was widely criticized, both by those who felt is didn’t go far enough (see references below) and by some commission members who felt it went too far and resulted in conflicting minority reports.  

“I ask a simple question: how could the banks have engaged in such massive misconduct and wrongdoing without a single individual being involved? In a sense, it’s the immaculate corruption. It defies common sense, and the people of America know this.”     Angelides Letter to Department of Justice

Jail Bankers?

Is it Easier to Obscure Economic Truths with Words or Equations?

Philip Pilkington writes: Does mathematics, due to its formal nature, provided economists with clarity? This was then typically followed up with appeals to how economics might become a science by increasingly mathematising.

A good example of mathematics providing clarity is the case of the Keynesian multiplier. Even without inputting any numbers into the equation we can immediately discern the factors that will generate equilibrium income. It will be a component of autonomous consumption, investment, I, government spending, and exports, minus autonomous imports. It will also be positively multiplied by the consumption multiplier, and negatively multiplied by the import multiplier.

We know this because the components of income are in the numerator of the equation, while the multipliers are in the denominator. The multipliers are also being subtracted from/added to 1. The larger the denominator, the smaller the numerator and vice versa. So, anything that “subtracts” from the denominator — e.g. the consumption multiplier — will increase the ratio (same directional effect as adding to the numerator), while anything that “adds” to the denominator — e.g. the import multiplier — will decrease the ratio (same directional effect as subtracting from the numerator.

Compare this presentation, however, with your typical econometric study. Such studies contain innumerable “black boxes” in that the reasoning behind the assumptions made is often entirely unclear.

One thus spends hours attempting to interpret and reconstruct such a study and, all too often, one comes away realising that the assumptions lead one inevitably to interpret the results as being almost entirely arbitrary.

One recognises the labour that goes into such studies but at the same time untangling it becomes “a nightmare to live with”. Why? Because such studies do not promote clarity at all. Instead they promote complete and total obscurantism.

This is not to say that econometrics is entirely useless. As Keynes says in the Tinbergen critique: This does not mean that economic material may not supply more elementary cases where the method will be fruitful. Take, for instance, Prof. Tinbergen’s third example-namely, the influence on net investment in railway rolling-stock of the rate of increase in traffic, the rate of profit earned by the railways, the price of pig iron and the rate of interest. Here there seems a reasonable prima facie case for expecting that some of the necessary conditions are satisfied.

Alas, however, these mathematical techniques have a tendency, not to clarity at all, but to obscurantism and the moment one gives people a ticket allowing them to engage in obscurantist practices one runs the risk of spiking the proverbial punch.

It is far, far more difficult to engage in obfuscation and magical nonsense when using plain English than it is when using mathematics; not to mention the fact that it is far easier to catch people out. And as a general rule-of-thumb it is probably not unfair to say that as the number of equations grows, the lack of clarity tends to increase and so too do the difficulties in sorting the wheat from the chaff. It is thus the multiplication and proliferation of equations that tends to give rise to nightmares.

Math and Economics

More Women At the Top Increases Corporate Success

New research from The Peterson Institute for International Economics and Ernst and Young shows that having more female leaders in business can significantly increase profitability. The report, Is Gender Diversity Profitable? Evidence from a Global Study, reveals that an organization with 30 percent female leaders could add up to 6 percentage points to its net margin. This in-depth new study analyzes results from approximately 21,980 global publicly traded companies in 91 countries from a variety of industries and sectors.

“The impact of having more women in senior leadership on net margin, when a third of companies studied do not, begs the question of what would be the global economic impact if more women rose in the ranks?” said Stephen R. Howe, Jr., EY’s US Chairman and Americas Managing Partner. “The research demonstrates that while increasing the number of women directors and CEOs is important, growing the percentage of female leaders in the C-suite would likely benefit the bottom line even more.”

The research uncovered that nearly one-third of companies globally have no women in either board or C-suite positions, 60 percent have no female board members, 50 percent have no female top executives, and less than 5 percent have a female CEO. Yet, the positive correlation between women in C-level ranks and the bottom line is demonstrated repeatedly, and magnitude of the estimated effects is substantial.  Although the study found that there is no statistically observable impact of having a female CEO on organizational profitability, and the impact of women’s presence on the board is not statistically robust, the importance of having female management and presumably a pipeline of female future leaders is both robust and positive.

“As many companies and governments have rightly increased their focus on gender diversity in corporate leadership, The Peterson Institute and EY wanted to explore what key areas in business roles and in societal support for women in those roles, have the greatest return for revenue and economic growth,” said Adam Posen, President, The Peterson Institute for International Economics. “We have found that some policy initiatives are more promising than others to deliver benefits while promoting gender equality, and that the emphasis should be on increasing diversity in corporate management. At a minimum, the results from our unique global study strongly suggest the positive impact of gender diversity on firm performance and identify in which sectors and countries the most progress on diversity needs to be made.”

While no country has reached gender parity, there is substantial international variation in women’s representation. National averages for women’s participation on boards range from 4 percent in the case of Mexico to roughly 40 percent in Norway, with Latvia and Italy next in line at 25 and 24 percent, respectively. Similarly, fewer than 11 percent of Mexican executives are women, while women account for more than a third of Latvian and Bulgarian executives.

The research reveals differences across industry sectors, with the financial, healthcare, utility and telecommunications sectors exhibiting the highest rates of female executive and board representation, ranging from 16-18 percent for women executives, and 12-14 percent for women directors. Basic materials, technology, energy and industrials are the sectors exhibiting the lowest representation of women in top positions, ranging from 10-12 percent for women executives and 8-10 percent for women directors.

The research addresses other issues that impact women’s presence in corporate leadership, which is positively correlated with firm characteristics such as size, as well as national characteristics including policies for women’s education and family leave. The research’s statistical results suggest that at the firm level, the size of the company and the size of the board are robustly correlated with the presence of women on boards and in upper executive ranks (though not as CEOs).

This research sheds light on the importance of establishing modern workplace benefits, providing equitable sponsorship opportunities, and creating inclusive work environments.

The data points to other policy indicators positively correlated with gender diversity in management, and thus profitability, that  are often overlooked, including the importance of paternal (not just maternal) leave, and openness to foreign investment, which could be interpreted as a sign of broader tolerance for new ways of doing business. Paternity leave – resources that would allow, and even encourage, fathers to participate more equitably in taking care of children – is significantly greater in the economies with more gender-balanced corporations: the top 10 economies had 11 times more paternity leave days than did the bottom 10.


Middle Class Erosion Increases Inequality?

States Where the Middle Class Is Dying in the US There are many possible definitions of the middle class.  One very logical definition involves dividing incomes into five quintiles.  Then the income classes can be labelled as follows:

  • Lowest quintile:  Low Income
  • Second quintile:  Low Middle Income
  • Third quintile:  Middle Income
  • Fourth quintile:  Upper Middle Income
  • Highest quintile:  High Income

Based on income earned before taxes by the third quintile, middle class incomes in Rhode Island declined the most in the country. Incomes among middle class Rhode Island households fell by 3.1% from 2010 to 2014, while income among the state’s fifth quintile, the top 20% of state households, grew by 4.5%.  This is representative, but to a greater extent, of what has happened to the distribution of income across the U.S.  See next article.

Observations in this article about characteristics of the states with the greatest middle income losses (not all found in every bottom 10 states):

  • More regressive taxation.
  • Low or declining union membership
  • High property taxes
  • More than average employment decline

Econintersect:  However, ranking of growth in high incomes shows little correlation with the decline in middle incomes.  The ten states have an average rank of of 21 (rank 1 being the greatest high income gain).  None of the ten states ranked by greatest middle income loss ranked in the top ten for high income gain (Maine had the highest rank – 11th).  But neither did any of the top  ten states for middle income loss rank in the bottom two quintiles for high income gain (South Carolina had the lowest rank – 29th).  These observations appear to indicate that state by state the loss of middle income is not strongly associated with either (1) large high income increases or (2) general economic decline for a state.

Here are the ten states that have had the greatest middle income losses between 2010:

10.  Arkansas  9.  New York 8.  Montana 7.  California 6.  South Carolina 5.  Tennessee 4.  North Carolina 3.  Maine 2.  Georgia 1.  Rhode Island

FT_15.09.16_econInqualityUpdate

Infrastructure Investment?

Elizabeth Drew writes: It would be helpful if there were another word for “infrastructure”: it’s such an earnest and passive word for the blood vessels of this country, the crucial conveyors and connections that get us from here to there (or not) and the ports that facilitate our trade (or don’t), as well as the carriers of information, in particular broadband (if one is connected to it), and other unreliable structures. The word “crisis” is also overused, applied to the unimportant as well as the crucial. But this country has an infrastructure crisis.

The near-total failure of our political institutions to invest for the future, eschewing what doesn’t yield the quick payoff, political and physical, has left us with hopelessly clogged traffic, at risk of being on a bridge that collapses, or on a train that flies off defective rails, or with rusted pipes carrying our drinking water. Broadband is our new interstate highway system, but not everyone has access to it—a division largely based on class. Depending on the measurement used, the United States ranks from fourteenth to thirtieth among all nations in its investments in infrastructure. The wealthiest nation on earth is nowhere near the top.

Congress’s approval last December of a five-year bill to spend $305 billion to improve the nation’s highway system occasioned much self-congratulation that the lawmakers actually got something done. But with an increase in the gasoline tax politically off-limits, the means for paying for it are dubious and uncertain. This was the longest-term highway bill passed since 1998 and the thirty-fifth extension of an authorization of highway construction since 2005. Some of the extensions of the highway program approved by Congress lasted for only three months. The previous extension was for just over three weeks. Such practices don’t allow for much planning of the construction or repair of highways and bridges and mass transit systems.  Infrastrcture Repair in US

Why Banks Should Be Regulated

The problem is not that banks are too big too fail.  They are too important not to have democratic control.  This is the only business whose product is other people’s money.  Currently in the US, taxpayers’ money insures taxpayers’ accounts up to $250,000 so that banks can gamble with impunity.  Bank Regulation

Bank regulation

Corruption in the Ukraine?

 The International Monetary Fund is concerned about the decision of Aivaras Abromavicius to resign from the post of Minister of Economic Development and Trade, IMF Managing Director Christine Lagarde said.

“His recently announced resignation is of concern. If the allegations that he makes in his resignation are correct, then it is obviously an indication that anticorruption measures that were committed to by the government are not yet working. And there is more progress to be had in that area. We’ve known that all along,” she said.

Ukraine corruption?

China Sneezes and the World Catches Cold?

Andrew Sheng and Xiao Geng write: The Chinese economy has caught a surprisingly severe cold this winter – a cold so bad that almost all global markets are sneezing. During the first two weeks of 2016, the Shanghai Composite Index fell 18%. On January 15, the index closed at 2,901 – very close to the trough of last summer’s stock-market crash. Foreign analysts almost uniformly predict another market crash or even a hard landing. With oil prices dipping below $28 per barrel, the specter of a global economic pandemic has appeared.

China’s New Year financial-market shock has been attributed to several causes, primarily related to policy transparency and clarity. One was the reversal of China’s attempt to install a stock-market “circuit breaker,” which, far from tempering volatility, spurred a new wave of selloffs. The other – arguably more serious – problem was market confusion about the direction of the renminbi exchange rate, following a gradual but constant ten-day depreciation against the US dollar that fueled capital outflows, until the People’s Bank of China (PBOC) intervened.

According to the PBOC, the confusion arose from a technical change in the process of setting the renminbi exchange rate, with the common reference rate against the US dollar replaced by a rate established on the basis of an undisclosed basket of key international currencies. This reform may be intended to boost the renminbi’s stability; but it is not good for markets, which prefer stability against the dollar to the uncertainty of a managed float.

This is not the first time markets have felt blindsided by well-meaning reforms. Unclear policy communication was compounded by global developments. The US Federal Reserve’s decision in December to raise the federal funds rate, together with the uncertainty generated by collapsing oil prices, has also spurred investors to reduce their China exposure and switch to dollars.

China’s government has reiterated its commitment to implementing tough market-oriented reforms, including measures to address environmental pollution, overcapacity, excessive debt, high taxes, bureaucratic red tape, and monopoly privileges for state-owned enterprises (SOEs).

All modern economies struggle with the inconsistency between sharp and volatile short-term price movements in financial markets and more gradual long-term structural adjustments in the real economy. Unlike in the past, when Chinese policymakers were able to concentrate on the real economy without worrying about excessive financial-market instability, they now must manage short-term volatility caused by liberalized interest and exchange rates, together with larger and faster capital flows both within and across borders.

Only with market-savvy central- and local-government officials and SOE managers can China implement short-term stabilization measures or long-term structural reforms. The problem  is that such talent is not widely available in the country.

The key to attracting market-oriented talent to China’s large bureaucracy is to make it clear that risk-taking – and even failure – will be tolerated. Only if skilled officials feel comfortable making real-time decisions under uncertain conditions can the state keep pace with markets, responding effectively to new developments and thus maintaining high levels of confidence.

China is in a strong position to handle the challenges that it faces. Growth, while slower than in the last three decades, remains relatively strong, as does China’s foreign-asset position and its central-government and household-sector balance sheets. Stable markets need stable policy transitions. By installing officials with strong policy credibility and the ability to handle market volatility deftly, China can complete its transition to a more market-oriented, innovation-driven economy – one that also supports stronger global growth.

China Sneezes?

Are Interest Rates More Important than Inequality?

Antonio Foglia writes:  Everyone seems to be talking about – and condemning – today’s rising level of economic inequality. Fueled by jarring statistics like Oxfam’s recent revelation that the world’s richest 62 people own as much wealth as the poorest 3.6 billion, popular support for left-wing figures like America’s Bernie Sanders and Britain’s Jeremy Corbyn is rising.

Many of those engaged in the debate on inequality nowadays cite the French economist Thomas Piketty’s 2014 book Capital in the Twenty-First Century, which makes three key points. First, over the last 30 years, the ratio of wealth to income has steadily increased. Second, if the total return on wealth is higher than the growth in incomes, wealth is necessarily becoming increasingly concentrated. Third, this rising inequality must be reversed through confiscatory taxation before it destroys society.

The points might seem convincing at first glance.

From 1980 on, nominal interest rates fell dramatically. Not surprisingly, the value of wealth rose much faster than that of income during this period, because the value of the assets that comprise wealth amounts essentially to the net present value of their expected future cash flows, discounted at the current interest rate.

The most straightforward example is a government bond. But the value of a house is determined in a similar manner: according to the rent it is expected to generate, capitalized at the current nominal interest rate. Equities, too, are valued at a higher multiple of earnings when interest rates fall.

In determining the value of total wealth, Piketty included both the income generated by assets and their appreciation. Meanwhile, incomes were capitalized at declining interest rates for more than a generation.

What impact do lower interest rates have on measured inequality? If I own one house and my neighbor owns two, and falling interest rates cause the value of those houses to double, the monetary inequality between us also doubles, affecting a variety of statistical indicators and triggering much well-intended concern. But the reality is that I still own one house and my neighbor still owns two. Even the relative affordability of houses doesn’t change much, because lower interest rates make larger mortgages possible.

The real-world impact of this dynamic on inequality is precisely the opposite of what Piketty would expect. Indeed, not only are Italians, on average, much richer than Germans; Italy’s overall wealth distribution is much more balanced.

A 2013 study of household finances in the eurozone, conducted by the European Central Bank, showed that in 2010 – the last year in Piketty’s research – the average Italian household was 41% richer than the average German household. Moreover, whereas the difference between mean and median household wealth is 59% in Italy, it is a whopping 282% in Germany.

This difference can be explained largely by the fact that 59% of households in Italy own homes, compared to only 26% in Germany. A larger share of Italians has thus benefited more from a larger drop in interest rates.

Then there are the numerous factors affecting incomes, such as demand for particular skills. For those whose skills are not in demand, the availability of skills upgrading or training opportunities will have a significant impact on income prospects.

Clearly, economic inequality is a highly complex phenomenon, affected by a wide variety of factors – many of which we do not fully understand, much less control.

Perhaps a new approach is not necessary at all. After all, globally, standards of living are continuously improving and converging. That is something that everyone, from the emerging populists to the hardened capitalists, should be able to agree on.

Interest Rates?

Impact of Devalued Renminbi

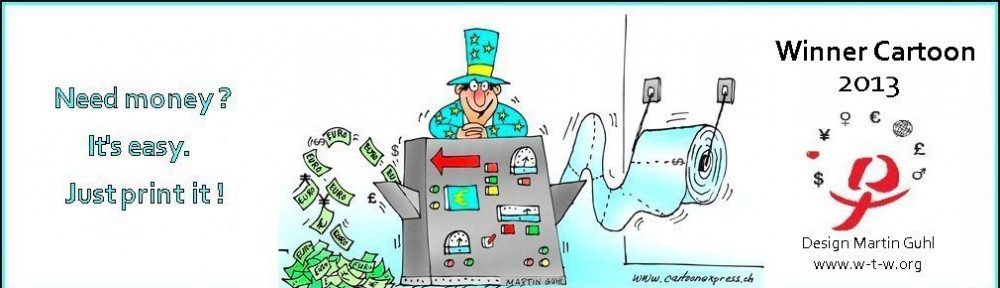
Kenneth Rogoff writes:  Since 2016 began, the prospect of a major devaluation of China’s renminbi has been hanging over global markets like the Sword of Damocles. No other source of policy uncertainty has been as destabilizing. Few observers doubt that China will have to let the renminbi exchange rate float freely sometime over the next decade. The question is how much drama will take place in the interim, as political and economic imperatives collide.

It might seem odd that a country running a $600 billion trade surplus in 2015 should be worried about currency weakness. But a combination of factors, including slowing economic growth and a gradual relaxation of restrictions on investing abroad, has unleashed a torrent of capital outflows.

Private citizens are now allowed to take up to $50,000 per year out of the country. If just one of every 20 Chinese citizens exercised this option, China’s foreign-exchange reserves would be wiped out. At the same time, China’s cash-rich companies have been employing all sorts of devices to get money out. A perfectly legal approach is to lend in renminbi and be repaid in foreign currency.

A not-so-legal approach is to issue false or inflated trade invoices – essentially a form of money laundering. For example, a Chinese exporter might report a lower sale price to an American importer than it actually receives, with the difference secretly deposited in dollars into a US bank account (which might in turn be used to purchase a Picasso).

Now that Chinese firms have bought up so many US and European companies, money laundering can even be done in-house. The Chinese hardly invented this idea. After World War II, when a ruined Europe was smothered in foreign-exchange controls, illegal capital flows out of the continent often averaged 10% of the value of trade or more. As one of the world’s largest trading countries, it is virtually impossible for China to keep a tight lid on capital outflows when the incentives to leave become large enough.

Indeed, despite the giant trade surplus, the People’s Bank of China has been forced to intervene heavily to prop up the exchange rate – so much so that foreign-currency reserves actually fell by $500 billion in 2015. With such leaky capital controls, China’s war chest of $3 trillion won’t be enough to hold down the fort indefinitely. In fact, the more people worry that the exchange rate is going down, the more they want to get their money out of the country immediately. That fear, in turn, has been an important factor driving down the Chinese stock market.

There is a lot of market speculation that the Chinese will undertake a sizable one-time devaluation, say 10%, to weaken the renminbi enough to ease downward pressure on the exchange rate. But, aside from providing fodder for the likes of Donald Trump, who believes that China is an unfair trader, this would be a very dangerous choice of strategy for a government that financial markets do not really trust. The main risk is that a big devaluation would be interpreted as indicating that China’s economic slowdown is far more severe than people think, in which case money would continue to flee.

There is no easy way to improve communication with markets until China learns how to produce credible economic data. It was a huge news story when China’s 2015 GDP growth was reported at 6.9%, just short of the official target of 7%. This difference ought to be irrelevant, but markets have treated it with the utmost importance, because investors believe that things must be really bad if the government can’t rig the numbers enough to hit its target.

A good place for the authorities to start would be to establish a commission of economists to produce a more realistic and believable set of historical GNP figures, paving the way for more believable GNP figures going forward. Instead, the government’s immediate idea for relieving exchange-rate pressure is to peg the renminbi to a basket of 13 currencies, instead of just to the US dollar. This is a good idea in theory; in practice, however, basket pegs tend to have chronic transparency problems.

Moreover, a basket peg shares most of the problems of a simple dollar peg. True, the euro and yen have fallen against the dollar over the past couple of years. If the dollar retreats in 2016, however, the basket peg implies a stronger renminbi-dollar rate, which might be unhelpful. The government has also indicated that it intends to clamp down more heavily on illegal capital flows; but it will not be easy to put that genie back in the bottle.

Life would be a lot easier today if China had moved to a much greater degree of exchange-rate flexibility back when the going was good, as some of us had advised for more than a decade. Maybe the authorities will be able to hold on in 2016; but it is more likely that the renminbi will continue its rocky ride – taking global markets along with it.

Renminbi